Assessing whether your data meets the assumptions of the model you use to analyze it is fundamental to ensure validity of the analysis. BOLD time-series are known not to meet the several assumptions of parametric testing (see this paper for an overview), particularly with respect to homoschedasticity (i.e., the assumptions that the variances are equal across — for instance — your subjects) and homogeneity of the sample (i.e., outliers).
In this presentation I cover two situations in which assumption infringement might cause misleading (or entirely erroneous) conclusions, suggesting that it might be better to apply non-parametric methods such as Spearman or Wilcox Skipped Correlations (for correlations) or permutation testing (for group level inference).
The main takeaways from the presentation and papers below is the following: use non-parametric methods.
- For ROI-correlations: instead of Pearson’s correlation, use Spearman’s rank correlation or Wilcoxon rank correaltion
- For group-level full brain analysis: Use permutation testing. FSL offers the great randomise*, SPM offers SnPM, and there is a tool called BROCCOLI by Eklund which promises GPU-fast permutation testing.
-
*randomise has one MAJOR MAJOR perk: you can use Threshold-Free Cluster Enhancement (TFCE) which allows you to not have to chose a cluster forming threshold. You just say "I want a FWE of 0.05" and it figures the rest out for you. I cannto imagine life getting any better than that..
1. ROI analysis of correlations between brain and behavior
Rousselet GA & Pernet CR (2012) Improving standards in brain-behavior correlation analyses, Frontiers in Human Neruoscience, doi: 10.3389/fnhum.2012.00119
In this paper the authors show in both synthetic and published data the evil that can come from using the standard Pearson correlation when there are outliers (which can either give you the false impression that there is a significant correlation when there is none, or can mask a significant correlation making it appear non-significant or significant but weaker). Alternative statistics that suffer less from these problems are the Spearman correlation, which is a Pearson correlation performed on the data rank, and the Skipped correlations approach which, simply put, calculates a Spearman coefficient on the data rank after multivariate outliers have been flagged as such.
2. Group level analysis of BOLD data
Eklund et al (2015) Can parametric statistical methods be trusted for fMRI based group studies? arXiv:1511.01863 .
This paper is a MUST READ. The short story is that, by looking at T-tests (1-/2-sided), conventional (parametric) group analysis, with the standard voxelwise or cluster correction, in most cases return, for a nominal α of 5%, an actual error rate up which can be to 35-40% (with the e
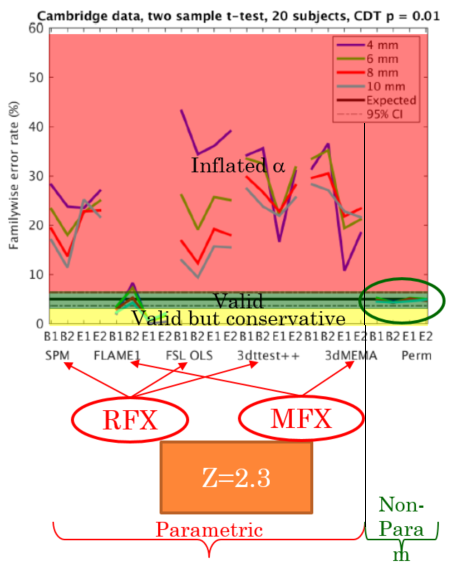
xception of FSL-FLAME which, by using a GLS actually is valid and, if anything, is conservative). Importantly, tools that use a standard Random Effects (OLS) approach, and therefore assume sphericity at the group level, do terribly (e.g., standard SPM, AFNI’s 3dttest++, FSL with the OLS option). Theoretically tools making use of first-level variances, as the FSL people have preached for a long time now, do much better (and this is indeed the case for FSL-FLAME). AFNI’s 3dMEMA (which indeed stands for Mixed-Effects Meta Analysis) should also do great, but, alas, it does not. To give you a feel for the data, here is an annotaded version of Eklund’s result for a 2-sample t-test with a cluster correction (using a clusterforming threshold of Z=2.30; i.e., p=0.01). As you can see, with the exception of FSL-FLAME (and, of course the non-parametric approach), all other algorithms give massive inflation of the familywise error rate (i.e., fall in the red ‘danger’ area!). The paper goes in to much more detail (which you should definitely read), but the short story is that the empirical error rate of current group analysis strategies depends on all sorts of things (most of which are decisions you — often idiosyncratically — make):
- paradigm (block/event related)
- spatial smoothing
- inference level (voxel v cluster)
- cluster thresholding method
- normality of the distribution of β across subjects [which, good peace to Drs Kolmogorov and Smirnov, are not normal; see Thirion et al., below]
- All the gaussian Random Field Theory assumptions (e.g., is the smoothness of your data spatially stationary? [no, it is not] Does the spatial autocorrelation function in your data approximate a squared exponential? [no, it does not])
So just forget all of these factors and go non-parametric, which doesn’t seem to be affected by any of the factors above! The main assumption of permutation-based tests is exchangeability. Now, subject, typically are exchangeable, but TRs (i.e., volumes) are not — unless, I’m guessing, you remove temporal autocorrelation before hand (and you do a good job at it, which is not always obvious).
Thirion et al (2007) Analysis of a large fMRI cohort: Statistical and methodological issues for group analyses, NeuroImage 35: 105-120.
In this paper the authors show the effect of sample size, thresholding method, and group level model (e.g., random versus mixed effects) — among others — on the reliability of fMRI group results. A couple key findings stand out: (1) N=20 is a minimum necessary for a reasonable reliability of the results, though the number should be closer to 27 to be in the decreasing return end of the curve. (2) Non parametric approaches (e.g., permutation testing) are preferable, so use SnPM, or FSL randomize, which has the added bonus of using Threshold-Free Cluster Enhancement (TFCE) which performs cluster correction without requiring you to give it an (arbitrary) cluster forming threshold!
Woolrich M (2008) Robust group analysis using outlier inference, NeuroImage 41: 286-301.
In this paper Mark Woolrich develops an approach that is resistant to violations of sphericity at the group level by using two key insights: (1) Using the low level (i.e., the single-subject “within”) variance; and (2) modeling errors as being a mixture of two Gaussian distributions: one for the “well behaved” population and one for the outliers.
Nichols TE & Holmes AP (2001) Nonparametric permutation tests for functional neuroimaging: a primer with examples, Human Brain Mapping 15: 1-25.
If you are even remotely thinking about doing non-parametric analysis with permutation testing (which you definitely should) you have to read this paper. Very accessible, thorough and clear!